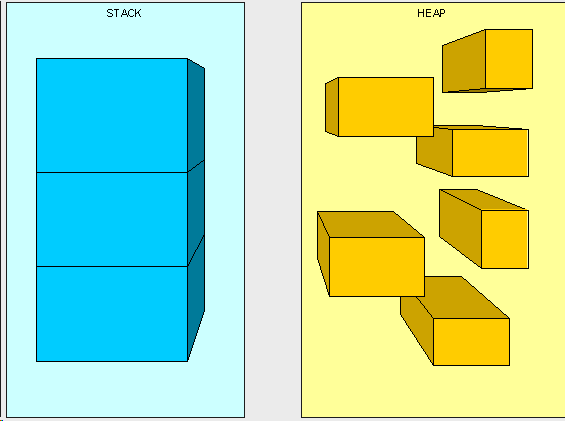
Today we are going to talk all about memory. There are multiple types of memory when it comes to software, but for now we are only interested in two of them: the Stack and the Heap. Whenever we execute a program, its instructions are loaded into the RAM of the computer, and the operating system will allocate a bunch of physical RAM, so that the executable can run. As you will find out in this lesson, the Stack and the Heap are two memory areas located in the computer’s RAM. There are multiple differences between these two kind of memory, both characteristics and functionality wise, and the first of them is the size. The Stack is a predefined size memory, with about 2 megabytes capacity, while the Heap, being also kind of predefined in size, it is much larger, and it can expand as the execution requires. So, first of all, why do we even need memory, why do we need the RAM? The reason why programs require memory to run is because they need to store and process data. It would be a very inefficient process to store, read, modify and write all this data on the hard drive. So, the RAM allows our programs to store data from variables and stuff, while very efficiently allowing us to modify or process it. Even if they both fundamentally provide the same functionality, the Stack and the Heap are very different in the way they operate.
The Stack is generally used to keep a track of our program’s functions and methods calls. Whenever we call a method or a function, that call is stored inside the Stack. Also, the Stack is a contiguous (continuous, in a row) block of memory. For these reasons, you can think of the Stack as a pile of boxes, one on top of the other. You cannot directly put a box in the middle of the stack, just like you cannot take a box without crashing the whole pile. Whenever we add a box, we add it at the top end of the pile, and only there, and same when we take a box – we only take them one by one, starting from the top end alone.
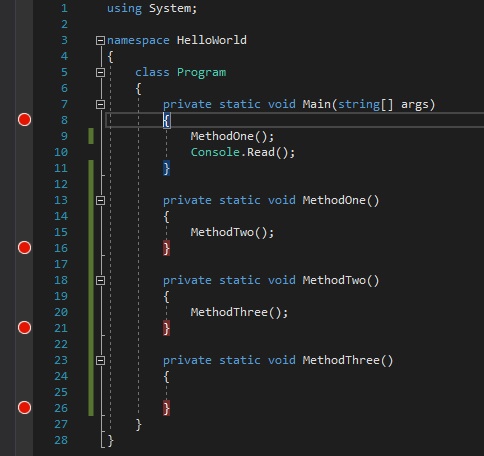
To better visualize this, let’s take the following code:
using System;

namespace HelloWorld
{
    class Program
    {
        private static void Main(string[] args)
        {
            MethodOne();
            Console.Read();
        }

        private static void MethodOne()
        {
            MethodTwo();
        }

        private static void MethodTwo()
        {
            MethodThree();
        }

        private static void MethodThree()
        {

        }
    }
}
Very simple code: we have our Main() method which calls a method called MethodOne(), which calls a method called MethodTwo(), which again calls a method named MethodThree(), which does nothing.
Set a breakpoint at the beginning of the Main() method, and at the end of all the other methods, like this:
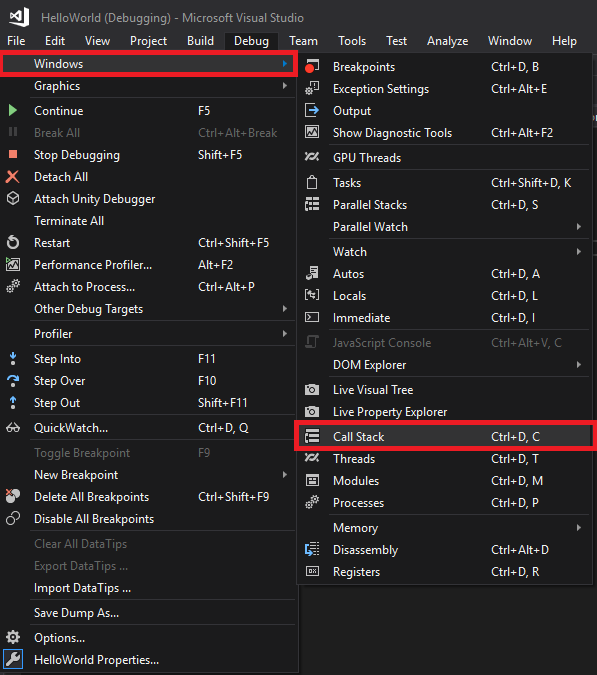
Run your program. As expected, when the execution will hit the breakpoint in the Main() method, it will be paused and we will enter in debugging mode. Nothing new so far. But, what we are interested in is a panel called Call Stack, located at the bottom of Visual Studio. If you can’t find it, it can be displayed by going to the Debug menu, Windows submenu and choosing Call Stack:
Be aware that this window is only available in debugging mode, so don’t be surprised if you don’t find it while your program is executing or stopped in design mode.
So, let’s take a look at this panel. When the first breakpoint, the one in the Main() method is hit, we will get this:
We will see a breakpoint just like the one that is currently hit, but with some additional information near it, like the Module name (methods are stored in classes, classes are stored in modules, modules are stored in assemblies, but you don’t have to worry about that for now), the name of our assembly, the class and the method which was called, plus its parameters, and some other stuff like the code language and the line number where the method was called.
Press the Continue button, and you will see the execution being transferred to MethodThree(), pausing at the breakpoint at the end of it. We already know from previous lessons that this happens because the method calls execute before the end of the methods is reached, so, following the program’s logic, the execution jumped from the Main() method to MethodOne(), then to MethodTwo() and finally to MethodThree(), at which end’s it stopped where the breakpoint was set. If you need to follow this logic step by step, you can restart the execution from the first breakpoint and constantly press Step Into, to see the flow of the execution.
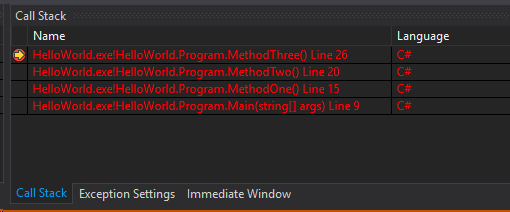
Now, when we are at the end of MethodThree(), let’s take a look at the Call Stack again:
We can clearly see that we have 4 calls, starting with the Main() call at the very bottom (Main() method was called by the Common Language Runtime, CLR) and ending with MethodThree() at the top. This is in perfect agreement with what I said earlier, that the Stack can be viewed like a contiguous pile of boxes, one on top of each other. If you go on pressing Continue, you will see the execution jumping and stopping to the breakpoints in MethodTwo(), MethodOne() and finally returning to Main(), where it will reach the Console.Read() instruction. At the same time, we will see the Call Stack following the same path, eliminating the calls one by one, as they end. In other words, the Call Stack keeps a record of all the method calls we are doing in our program, by adding them when they are called and removing them when the calls end. If you still remember, this is not very unlikely to the Stack data structure; In fact, the Stack itself can be viewed as this exact data structure, with the only difference that it doesn’t have a general storing functionality – it only stores method calls, and it is fully automated – it doesn’t allow the direct user intervention.
Yet another useful feature of the Call Stack, aside of the fact that we can see the whole path followed by our program’s calls, is that we can double click on one of the rows, which will revert the execution to that particular call. That could be helpful at times.
Sometimes, specially in GUI programs, and specially when you will use external libraries (we will learn about adding library references in the future), you will notice that the Call Stack will contain a lot of calls that you didn’t make personally. For instance, if you have a button and you set a breakpoint in its Click event handler, you will notice that when the breakpoint is hit, there is a whole bunch of calls in the Call Stack, ending with the Click method call, at the top. The additional calls are just the result of abstraction and layering of software. Unlike our example, where the code is very simple and straightforward, a Click event handler actually calls A LOT of other low level framework methods, behind the curtains. All those calls are displayed in the Call Stack, and you may or may not be interested in them.
Also, sometimes you will see rows in the Call Stack that read as [external code]. Those are just calls that have been encapsulated and hidden from the user. You may not concern yourself with them for the time being.
The Stack and the Heap are memory areas. They are only used to store things, and more precise, value types, reference types, pointers, and instructions. Value types are bool, byte, char, decimal, double, enum, float, int, long, sbyte, short, struct, uint, ulong and ushort. They are value types because they are declared in the System.ValueType namespace. Reference types are class, interface, delegate, object and string; they are all inheriting from System.Object, except the object, which is the System.Object object itself.
Reference types are always stored on the Heap. And, alas, if you will do a quick Google search, you will find plenty of examples that will tell you that the difference between the Stack and the Heap is the fact that the reference types are stored on the Heap, while the value types are always stored on the Stack. Even the Microsoft documentation says so. However, that IS NOT ENTIRELY TRUE! Value types are stored on the Heap, Stack, or Registers (another kind of memory), depending where they are declared and the length of their lives. If they are methods parameters and local variables to some method or function, they are stored in the Stack, which is most often the case. If they are declared directly inside a reference type (like declaring an int directly inside a reference type, like a class, also known as declaring a field variable), they are stored on the Heap, along with their enclosing reference type.
Most programmers will tell you that another difference between the Stack and the Heap is that the interaction with the values stored on the Stack is easier and faster than those stored on the Heap. That is only partially true. The difference in performance between declaring a value and a reference type is negligible. The difference in interacting with values from Stack and Heap is also negligible (in most cases!). So, the only real difference is when the values are no longer needed and they need to be removed. Since the Stack is a linear storing medium, the performance cost of removing variables and reclaiming memory is small, because the memory blocks do not require to be re-arranged to fill any gaps; the deleted memory is always at the top of the Stack. On the Heap, however, because the values are stored in a spread way, when they are not used anymore (a complex process involving pointers, which we haven’t discuss yet), they are deleted by a special component of the .NET Framework, called a Garbage Collector (GC for short). The GC will not clear the memory of unused objects all the time; it will do so at certain intervals, which are a complex subject. However, when the memory is being cleared, holes will appear in memory, which need to be filled; thus, the GC will also re-arrange all the Heap values so that they are in a contiguous structure again. This process is a very expensive one, performance wise. However, what most programmers don’t know is that the Heap memory is split in three areas: short, medium and long lived heap areas; objects start of in the short lived area. If they survive a garbage collection (they are still needed by the software), they are moved to the medium lived area of the heap. Similarly, if they survive yet another cleaning, they are moved to the long lived area. This way, the memory remains somehow more organized, with the long and medium lived blocks being re-arranged relatively rarely. The only area that is very costly when it comes to garbage collection is the short lived area.
This is the reason why most programmers are somewhat correct. The Heap can be more expensive to use, in terms of performance, but only if the objects we allocate there are short lived and numerous.
It is a pity that most programmers, including the professional ones, consider that the value types are better to work with, for the sole reason of being allocated on the Stack, not on the heap. Not only this is not entirely true, but the whole idea is wrong. The relevant feature of value types is that they have the semantics of being copied by value, not that sometimes their de-allocation can be optimized by the runtime. Otherwise, if this was the relevant feature about types, they would be called stack types and heap types, not value and reference types.
Tags: garbage collector, GC, heap, memory, RAM, stack, value and reference types


